Tag Archives: Pro

Inequality and the death toll of future climate change

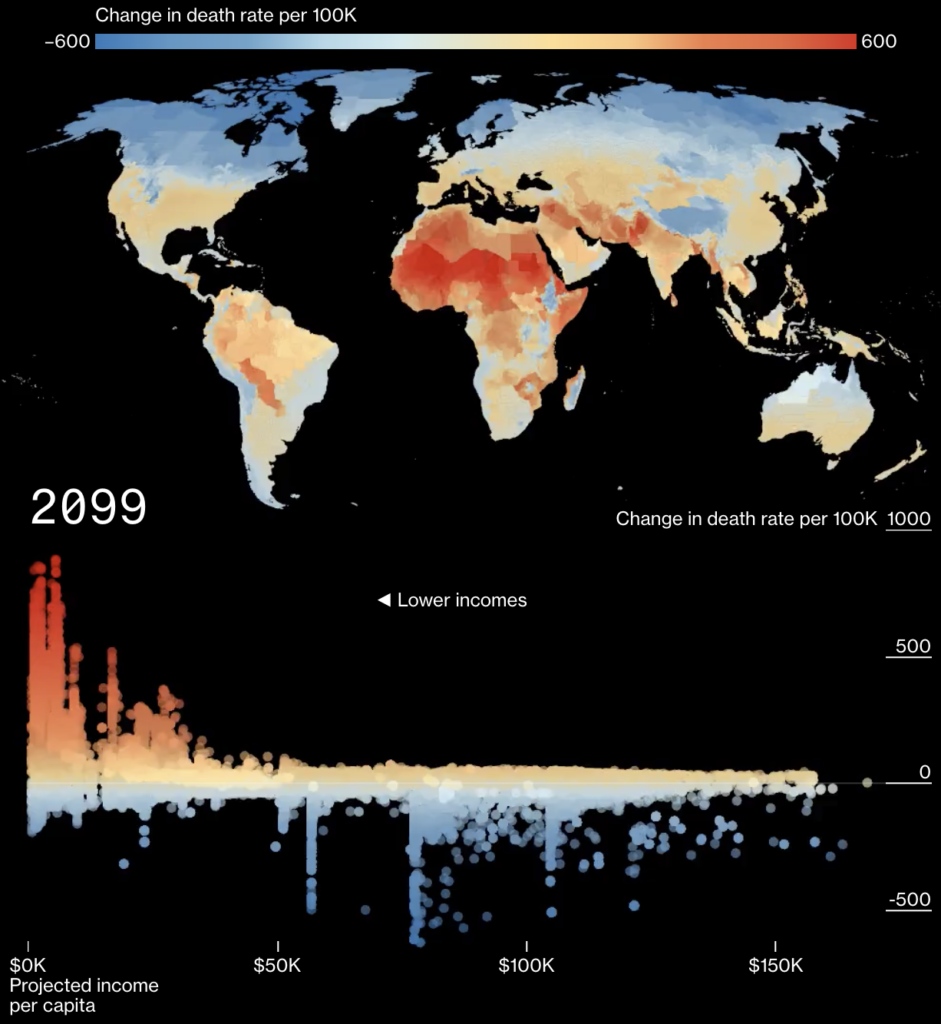
The Climate Impact Lab just got a great write-up for our work on the risk of mortality under climate change in Bloomberg Green. There are a bunch of excellent dynamic visualizations that dig into the data.

There are two big messages here. The first is that poor people are going to get hammered by climate change, with some areas experiencing deathrates from the additional heat that are greater than the combined global rates for heart disease, stroke, all forms of cancer, all forms of infectious disease death, and all forms of death from injury.

The other is that we can use this information to start to estimate the total cost of climate change to society at large, because it gives us a lower-bound. Just the effect of additional mortality costs society about $22 per ton of CO2. That’s already more than the total social cost used by the Trump administration and half way to the total cost used by the Obama administration.

Take a look at the summary write-up of the research behind the Bloomberg article, and look forward to the reports that we are going to produce on the effects of climate change on labor productivity, agriculture, energy demand, and coastal impacts.

Introducing a tutorial on climate econometrics

There is a rising tide of people who want to get involved in climate econometrics, dissipating against the shallows of unfinished research ideas, and spinning like weather vanes trying in vain to understand weather. Well, no longer! I would like to introduce climateestimate.net!

ClimateEstimate.net is an introduction to the secrets of using climate data, generating weather panels, choosing specifications, and getting results. Think of it like a practical complement to Solomon Hsiang’s SHCIT list:
http://www.g-feed.com/2018/11/the-shcit-list.html

The tutorial is still new, and we would love your feedback and suggestions. And you are welcome to get involved and help us extend the tutorial (there’s an ocean still to cover!).

Water-energy-food modelling for the 21st century

The highest good is like water.
Water gives life to the ten thousand things and does not strive.
It flows in places men reject and so is like the Tao.

– Tao Te Ching (Lao Tzu)

Water is such a fascinating resource because it’s at the center of things: absolutely necessary, but generally given no value. This the fundamental enigma that has motivated a huge growth in the study of “water-energy-food systems” (WEF systems or nexus). But the WEF nexus are also defined to dodge the central problems of water.

The first dodge is by framing water as an equal partner with energy and food. As I’ve written before, water plays a very different role than energy or food: energy and food are completely dependent on water, not so much on each other. WEF systems should better be called “Greater Water Systems”.

The second dodge is a common avoidance of the fundamental decisions-making build into water systems. Water availability isn’t really a physical fact of nature: it depends on human decisions. Water grows scarce when we demand more than the natural system can provide. And in most areas of the world now, water supply is the result of our investments in reservoirs, canals, treatment and reuse systems. WEF systems have no static elements; it is constantly being created by us.

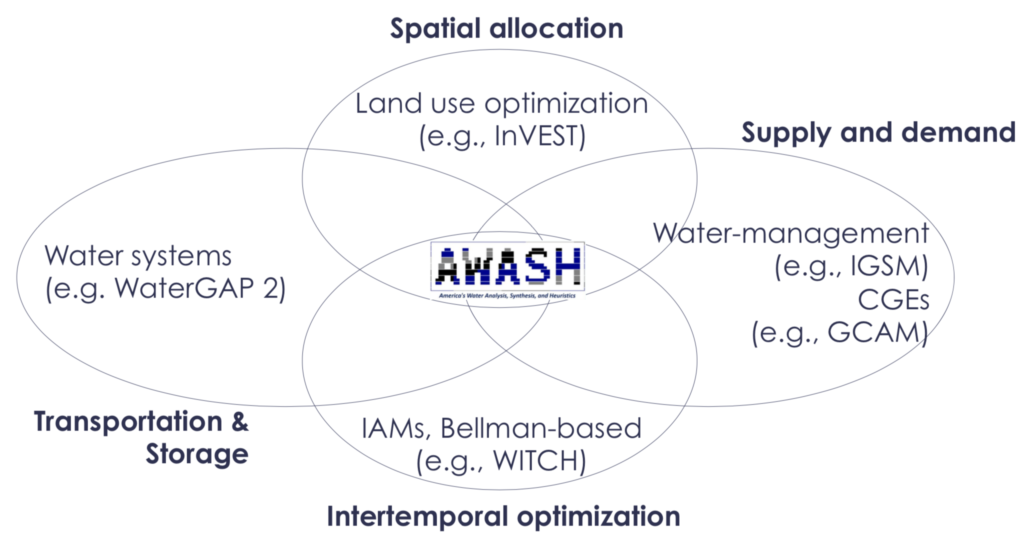
A full understanding of the WEF nexus requires an integrated approach, which makes decisions about water use and infrastructure, based on how we can ensure the most beneficial use of water for ourselves and the environment. I presented on these ideas at the 1st International Conference on Water Security, using the AWASH model to understand long-term investment decisions around reservoirs.

The insights from that work were published this week in the new journal Water Security. Take a look:

Decision-making and integrated assessment models of the water-energy-food nexus

The missing economic risks in assessments of climate change impacts

Through an expert elicitation involving LSE, Columbia University, and PIK, we have developed a statement for policy-makers on missing risks of climate change. Often the discussion of the risks of climate change focuses on what we know: higher temperatures and sea-levels, biodiversity loss, deaths from heat waves. But scientists are reticent to discuss what we do not yet understand: die-off of the Amazon, loss of the ocean currents that warm Europe, mass migrations and their conflict consequences.

Our paper says that even though we cannot yet quantify these risks, we should be planning for them. Even if the worst scenarios are unlikely to happen, leaving them out of our discussions with policy-makers is the same as claiming that their risk is zero, which is not right either. Governments regularly plan for international security scenarios that only have a 1-in-10,000 chance of happening, and we should treat the worst risks of climate change the same way.

Our document on the missing risks of climate change will be presented at the U.N. General Assembly Climate Action Summit, and we hope it will heat things up!

Connected oceans

Dividing an elephant in half does not make two small elephants. It makes one mess.

The same is true of our oceans. Modern management of the natural environment is all about dividing up elephants, assigning the halves to different owners, and blinding ourselves to the activities beyond our halves. But just as with elephants, pieces of an ocean depend on each other: fish and currents do not respect national boundaries.

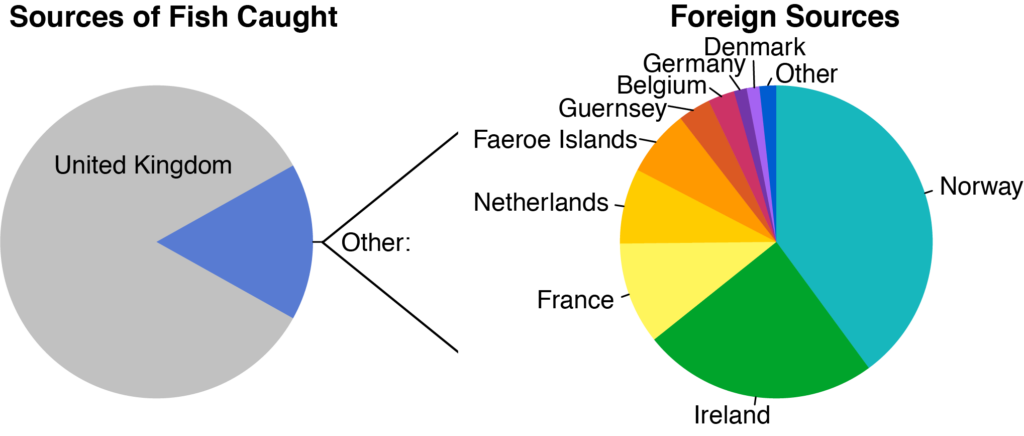
That is the starting point of a new paper Nandini Ramesh, Kimberly Oremus, and I recently published in Science, entitled “The small world of global marine fisheries: The cross-boundary consequences of larval dispersal“. We wanted to understand how national fisheries depended upon each other.

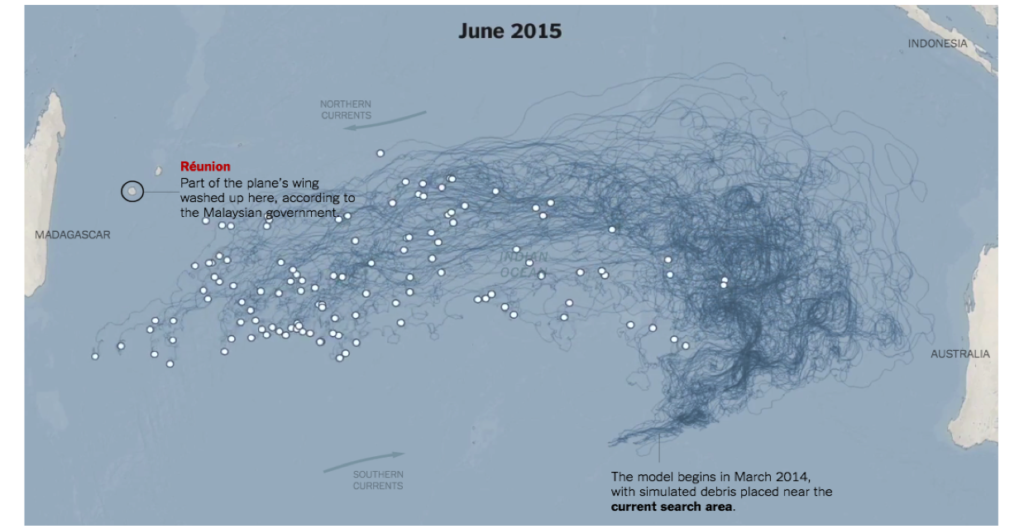
To study this, we used the same model used to study how debris from the Malaysia Airlines Flight 370 crash ended up halfway around the world:

Instead of looking at airplane debris, we looked at fish spawn. Most marine species spend a stage of their lives as plankton, either in the form of floating eggs or microscopic larvae. They can travel huge distances as they float with the currents, sometimes over the course of several months. We can use those journeys to identify the original spawning grounds of the adult fish that are eventually caught.

These connections are important, because they mean that your national fisheries depend upon neighboring countries. Spawning regions are highly sensitive, and if your national neighbors fail to protect them, the fish in your country can disappear. A country like the UK depends upon plenty of other countries for its many species.

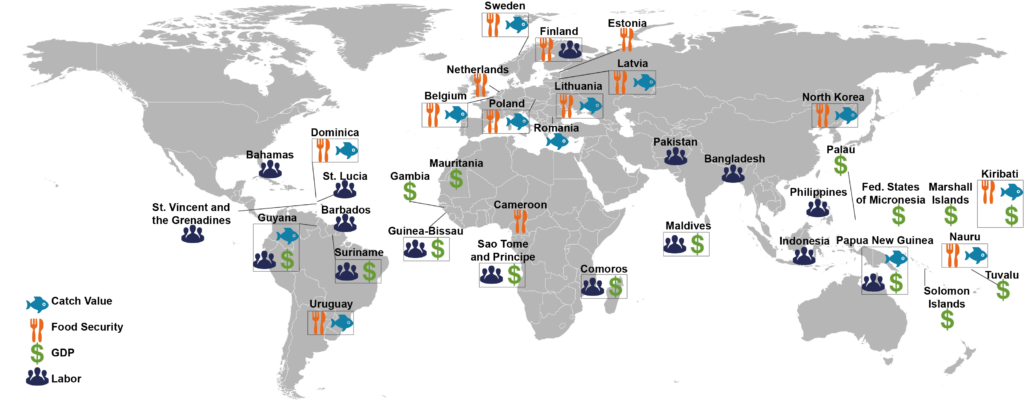
Finally, this is not just an issue for the fishing sector. We also looked at food security and jobs. People around the world depend on the careful environmental management of their neighbors, and it is time we recognized this elephant as a whole.

An unstoppable force

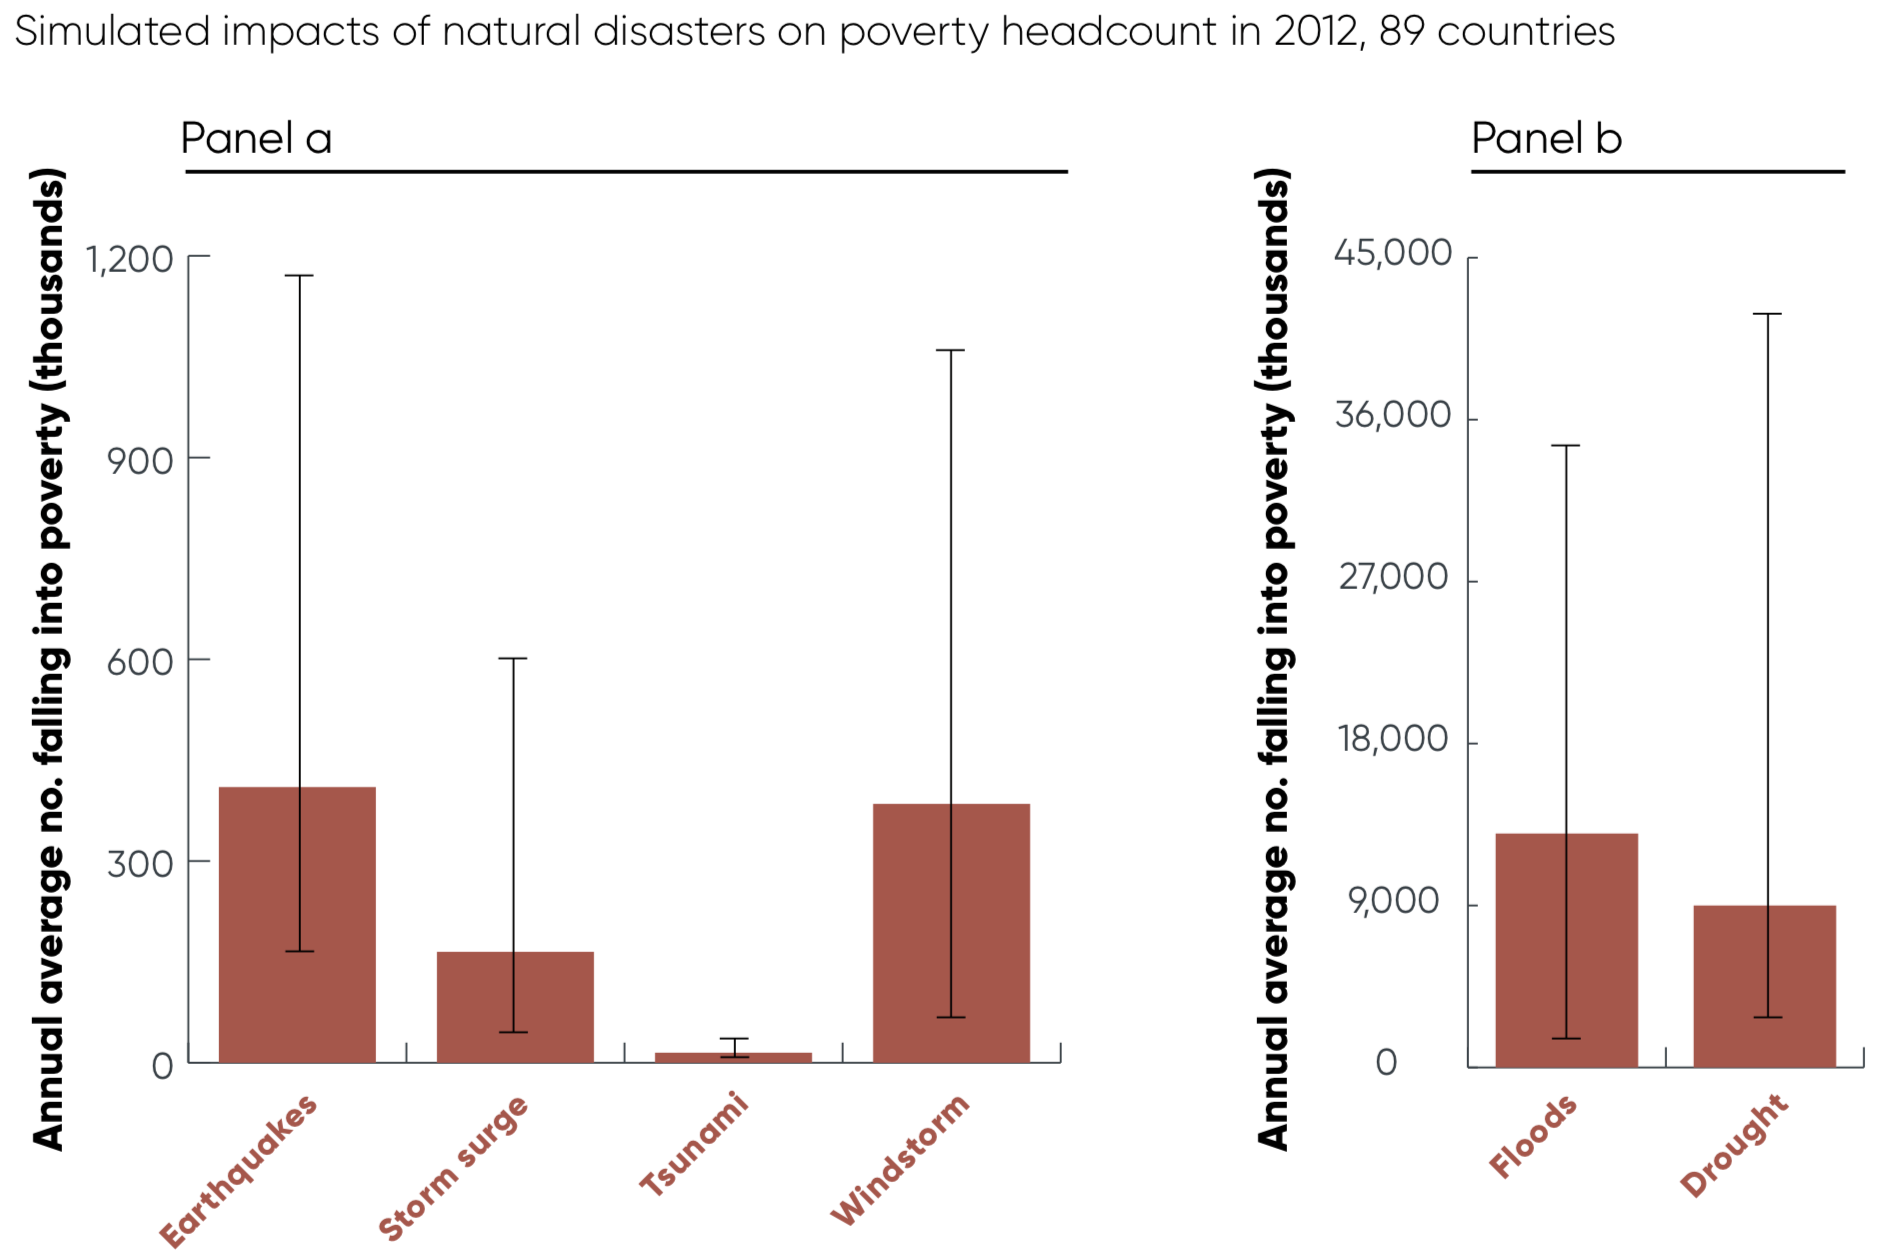
Shortly after I joined LSE, Stéphane Hallegatte from the World Bank gave a presentation on their new report, “Unbreakable”. The report is about how to measure risk in the face of the potential to fall into poverty, and includes one of my favorite graphs of the last year:

Unbreakable figure
From “Unbreakable”: Estimated people driven into poverty annually by natural disasters.

I think it’s an amazing bit of modeling to be able to relate natural events to the excruciatingly chaotic process we call “falling into poverty”. But it’s the scale of the two sides of the graph that blows me away. On the left, earthquakes, storm surge, tsunamis, and windstorms all together account for about 1 million people falling into poverty every year. On the right, floods account for 10x as many, and droughts account for an additional 8x as many.

The reason is that floods and droughts are naturally huge events– covering large areas and affecting millions of people– every time they occur. The second is that they occur all the time.

This gets at the importance of water. Most of the researchers I know don’t spend much time thinking about water. They know it’s important, but in a way that’s so commonplace as to be invisible. We just said that 18 million people fall into poverty each year from floods and droughts; in 2015 there were 736 million people in poverty total. That means that if we magically got everyone out of poverty today, in 41 years, there would have already been 736 million new instances of poverty from floods and drought alone. Water is about enough to explain the stubbornness of extreme poverty all on its own.

Improving IAMs: From problems to priorities

I wrote this up over the holidays, to feed into some discussions about the failings of integrated assessment models (IAMs). IAMs have long been the point at which climate science (in a simplistic form), economics (in a fanciful form), and policy (beyond what they deserve) meet. I’m a big believer in the potential of models to bring those three together, and the hard work of improving them will be a big part of my career (see also my EAERE newsletter piece). The point of this document is to highlight some progress that’s being made, and the next steps that are needed. Thanks to D. Anthoff and F. Moore for many of the citations.


Integrated assessment models fail to accurately represent the full risks of climate change. This document outlines the challenges (section 1), recent research and progress (section 2), and priorities to develop the next generation of IAMs.

1. Problems with the IAMs and existing challenges

The problems with IAMs have been extensively discussed elsewhere (Stern 2013, Pindyck 2017). The purpose here is to highlight those challenges that are responsive to changes in near-term research priorities. I think there are three categories: scientific deficiencies, tipping points and feedbacks, and disciplinary mismatches. The calibrations of the IAMs are often decades out of date (Rising 2018) and represent empirical methods which are no longer credible (e.g. Huber et al. 2017). The IAMs also miss the potential and consequences of catastrophic feedback in both the climate and social systems, and the corresponding long-tails of risk. Difficulties in communication between natural scientists, economists, and modelers have stalled the scientific process (see previous document, Juan-Carlos et al. WP).

2. Recent work to improve IAMs

Progress is being made on each of these three fronts. A new set of scientific standards represents the environmental economic consensus (Hsiang et al. 2017). The gap between empirical economics and IAMs has been bridged by, e.g., the works of the Climate Impact Lab, through empirically-estimated damage functions, with work on impacts on mortality, energy demand, agricultural production, labour productivity, and inter-group conflict (CIL 2018). Empirical estimates of the costs and potential of adaptation have also been developed (Carleton et al. 2018). Updated results have been integrated into IAMs for economic growth (Moore & Diaz 2015), agricultural productivity (Moore et al. 2017), and mortality (Vasquez WP), resulting in large SCC changes.

The natural science work on tipping points suggest some stylized results: multiple tipping points are already at risk of being triggered, and tipping points are interdependent, but known feedbacks are weak and may take centuries to unfold (O’Neill et al. 2017, Steffen et al. 2018, Kopp et al. 2016). Within IAMs, treatment of tipping points has been at the DICE-theory interface (Lemoine and Traeger 2016, Cai et al. 2016), and feedbacks through higher climate sensitivities (Ceronsky et al. 2005, Nordhaus 2018). Separately, there are feedbacks and tipping points in the economic systems, but only some of these have been studied: capital formation feedbacks (Houser et al. 2015), growth rate effects (Burke et al. 2015), and conflict feedbacks (Rising WP).

Interdisciplinary groups remain rare. The US National Academy of Sciences has produced suggestions on needed improvements, as part of the Social Cost of Carbon estimation process (NAS 2016). Resources For the Future is engaged in a multi-pronged project to implement these changes. This work is partly built upon the recent open-sourcing of RICE, PAGE, and FUND under a common modeling framework (Moore et al. 2018). The Climate Impact Lab is pioneering better connections between climate science and empirical economics. The ISIMIP process has improved standards for models, mainly in process models at the social-environment interface.

Since the development of the original IAMs, a wide variety of sector-specific impact, adaptation, and mitigation models have been developed (see ISIMIP), alternative IAMs (WITCH, REMIND, MERGE, GCAM, GIAM, ICAM), as well as integrated earth system models (MIT IGSM, IMAGE). The latter often include no mitigation, but mitigation is an area that I am not highlighting in this document, because of the longer research agenda needed. The IAM Consortium and Snowmass conferences are important points of contact across these models.

3. Priorities for new developments

Of the three challenges, I think that significant progress in improving the science within IAMs is occurring and the path forward is clear. The need to incorporate tipping points into IAMs is being undermined by (1) a lack of clear science, (2) difficulties in bridging the climate-economic-model cultures, and (3) methods of understanding long-term long-tail risks. Of these, (1) is being actively worked on the climate side, but clarity is not expected soon; economic tipping points need much more work. A process for (2) will require the repeated, collaboration-focused covening of researchers engaged in all aspects of the problem (see Bob Ward’s proposal). Concerning (3), the focus on cost-benefit analysis may poorly represent the relevant ethical choices, even under an accurate representation of tipping points, due to their long time horizon (under Ramsey discounting), and low probabilities. Alternatives are available (e.g., Watkiss & Downing 2008), but common norms are needed.

References:

Burke, M., Hsiang, S. M., & Miguel, E. (2015). Global non-linear effect of temperature on economic production. Nature, 527(7577), 235.
Cai, Y., Lenton, T. M., & Lontzek, T. S. (2016). Risk of multiple interacting tipping points should encourage rapid CO 2 emission reduction. Nature Climate Change, 6(5), 520.
Ceronsky, M., Anthoff, D., Hepburn, C., & Tol, R. S. (2005). Checking the price tag on catastrophe: the social cost of carbon under non-linear climate response. Climatic Change.
CIL (2018). Climate Impact Lab website: Our approach. Accessible at http://bit.ly/2SKT8XB.
Houser, T., Hsiang, S., Kopp, R., & Larsen, K. (2015). Economic risks of climate change: an American prospectus. Columbia University Press.
Huber, V., Ibarreta, D., & Frieler, K. (2017). Cold-and heat-related mortality: a cautionary note on current damage functions with net benefits from climate change. Climatic change, 142(3-4), 407-418.
Kopp, R. E., Shwom, R. L., Wagner, G., & Yuan, J. (2016). Tipping elements and climate–economic shocks: Pathways toward integrated assessment. Earth’s Future, 4(8), 346-372.
Lemoine, D., & Traeger, C. P. (2016). Economics of tipping the climate dominoes. Nature Climate Change, 6(5), 514.
Moore, F. C., & Diaz, D. B. (2015). Temperature impacts on economic growth warrant stringent mitigation policy. Nature Climate Change, 5(2), 127.
Moore, F. C., Baldos, U., Hertel, T., & Diaz, D. (2017). New science of climate change impacts on agriculture implies higher social cost of carbon. Nature Communications, 8(1), 1607.
NAS (2016). Assessing Approaches to Updating the Social Cost of Carbon. Accessible at http://bit.ly/1nY5dZX
Nordhaus, W. D. (2018). Global Melting? The Economics of Disintegration of the Greenland Ice Sheet (No. w24640). National Bureau of Economic Research.
O’Neill, B. C., Oppenheimer, M., Warren, R., Hallegatte, S., Kopp, R. E., Pörtner, H. O., … & Mach, K. J. (2017). IPCC reasons for concern regarding climate change risks. Nature Climate Change, 7(1), 28.
Pindyck, R. S. (2017). The use and misuse of models for climate policy. Review of Environmental Economics and Policy, 11(1), 100-114.
Rising, J. (2018). The Future Of The Cost Of Climate Change. EAERE Newsletter. Accessible at http://bit.ly/2SLnQ2F
Steffen, W., Rockström, J., Richardson, K., Lenton, T. M., Folke, C., Liverman, D., … & Donges, J. F. (2018). Trajectories of the Earth System in the Anthropocene. Proceedings of the National Academy of Sciences, 115(33), 8252-8259.
Stern, N. (2013). The structure of economic modeling of the potential impacts of climate change: grafting gross underestimation of risk onto already narrow science models. Journal of Economic Literature, 51(3), 838-59.
Vasquez, V. (WP). Uncertainty in Climate Impact Modelling: An Empirical Exploration of the Mortality Damage Function and Value of Statistical Life in FUND. Masters Dissertation.
Watkiss, P., & Downing, T. (2008). The social cost of carbon: Valuation estimates and their use in UK policy. Integrated Assessment, 8(1).
The power of informal transit

The Journal of Transport Geography just published a study that I worked on with Kayleigh Campbell, Jacqueline Klopp, and Jacinta Mwikali Mbilo. The question address is “How important is informal transit in the developing world?” (Jump to the paper.)

What’s informal transit?

A lot of people get around Nairobi in works of art on wheels called “matatus”:

The matatu system is extensive, essential, efficient, and completely unplanned. In Nairobi’s hurry to accommodate the transport needs of a population that grows by 150,000 people a year, it has ignored this piece of infrastructure. Sometimes it has even undermined it.

The goal of this paper is to measure how important matatus are, in the context of the whole range of transportation options and income groups.

What does this paper bring to the table?

This is one of very few analyses on informal transportation networks anywhere, building upon the incredible work of the Digital Matatus Project, co-led by our co-author, Dr. Klopp.

It’s also fairly unique in looking at transport accessibility in the developing world at all (most work on accessibility is done in rich countries). Not surprisingly, transport needs in developing countries are different.

What do we find?

Some of the results are unsurprising: matatus boost measures of access by 5-15 times, compared to walking, with accessibility highest in the central business district. Of somewhat more interest:

  • Matatu access drops more quickly then driving or walking accessibility as you move away from Nairobi’s center. That’s an indication of the structure of the matatu network, helping people in Nairobi center the most.
  • Controlling for distance from the center, richer communities have low accessibility. Many people from those communities have cars, but it matters because their workers do not. In fact this communities tend to be quite isolated.
  • Tenement housing has quite strong accessibility, because matatu networks tend to organize around it.

What tools do we have for research in this area?

We developed quite an extensive body of tools for studying (1) accessibility in general, and (2) transit networks in particular. If you find yourself in the possession of a cool new transit network database, in “GTFS” format, we have code that can analyze it. Prompt me, and I can work with you to open-source it.

Enjoy the new paper! Accessibility across transport modes and residential developments in Nairobi

Blockchain and the dystopian present

People often assume that since I have background in computers, I must be an enthusiast of blockchain technology. I have never seen much use for it, since anything that blockchains can do, a traditional database can do more efficiently. But I understand that blockchains have an application, a situation in which they are the right tool for the job: if you cannot build a trustworthy institution and want to keep shared records, blockchains will let you.

By institutions, I mean organizations like banks or government, which could keep these records, along with a common understanding of the rules they use. If I, as an individual, want to make a system for distributed, anonymous users to keep records, it is easy to make an interface to a database that provides that. I would define the rules, and my software would follow them. But then you have to trust me to not use my power over the rules to my advantage. Or, in the case of societal institutions, we have to believe in systems of oversight to ensure good behavior and procedures for responding to bad behavior. If you cannot trust a central authority, traditional databases will not work.

The cost to pay for this lack of trust is energy use. The blockchain mining system turns computing power into security, with bitcoin alone consuming more electricity annually than Austria (73 TWh/yr vs. 70 TWh/yr). Blockchain technology is built on plentiful, cheap energy.

I think the excitement about blockchain technology offers some insight into the world today, and the world that we are working to create. The world that blockchains are made for is a world of abundance, but abundance squandered by the lack of trusted institutions. And that is not all.

It is a world not overly concerned with inequality. If there was extreme inequality of mining power, or collusion at the top, blockchain ledgers could be forged. Instead, the fear is against petty theft. We worry about minor actors breaking the law, and no institutions to recognize it and undo the damage.

It is a world where anonymity is supreme. Letting institutions know our identity a necessary condition for allowing them to provide oversight. In a world of corrupt institutions, your identity might be used against you.

It is a world in which you pay to maintain your own security. As mining rewards dwindle, it will be those who have the most to lose who will maintain the system. But in this, it must also be a world of continual competition, because if a single user or cartel effectively paid for the whole system, it would also control the ledgers.

So, when people express such excitement about this or that application of blockchains, I mourn the loss of cooperation and common ground. Only a world of abundance could support blockchains, but only a fragmented world would need them.

Complexity Science Methods for Sustainable Development

I recently had the pleasure of speaking last week to the Science and Policy Summer School, in Paris. This is an interdisciplinary event that I helped to start back in 2011, under the tutelage of Laurence Tubiana, bringing together students from Columbia’s Sustainable Development program, Sciences Po’s IDDRI, and various Masters’ programs, to have some big discussions on bridging the gap between science and policy.

The topic for this year was “Methods in Sustainable Development”. For my part, I gave a 10,000 ft. view of Complexity Science, and some of the methods available from it.

Here is my complexity science methods presentation, in Prezi form.