Shortly after I joined LSE, Stéphane Hallegatte from the World Bank gave a presentation on their new report, “Unbreakable”. The report is about how to measure risk in the face of the potential to fall into poverty, and includes one of my favorite graphs of the last year:
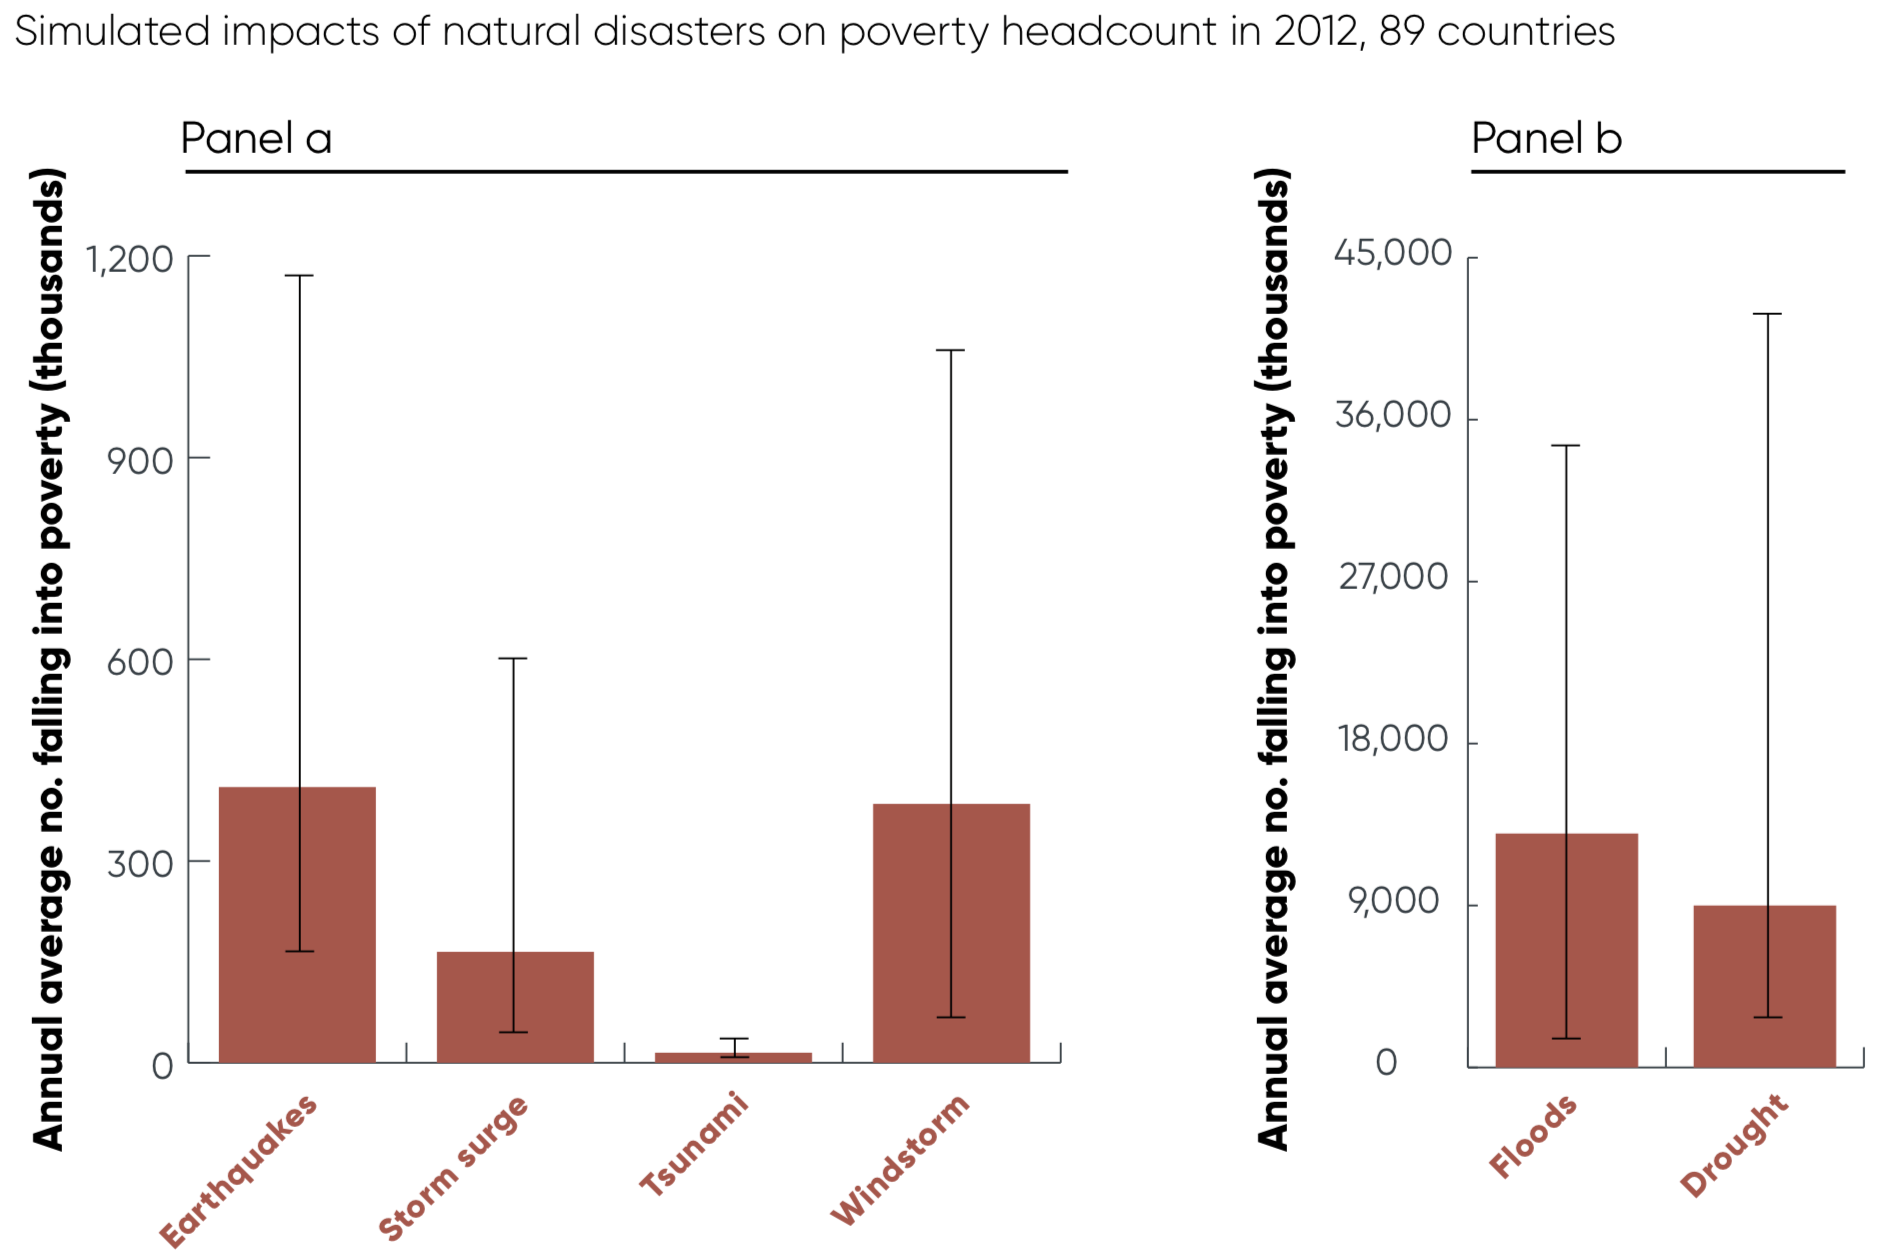
I think it’s an amazing bit of modeling to be able to relate natural events to the excruciatingly chaotic process we call “falling into poverty”. But it’s the scale of the two sides of the graph that blows me away. On the left, earthquakes, storm surge, tsunamis, and windstorms all together account for about 1 million people falling into poverty every year. On the right, floods account for 10x as many, and droughts account for an additional 8x as many.
The reason is that floods and droughts are naturally huge events– covering large areas and affecting millions of people– every time they occur. The second is that they occur all the time.
This gets at the importance of water. Most of the researchers I know don’t spend much time thinking about water. They know it’s important, but in a way that’s so commonplace as to be invisible. We just said that 18 million people fall into poverty each year from floods and droughts; in 2015 there were 736 million people in poverty total. That means that if we magically got everyone out of poverty today, in 41 years, there would have already been 736 million new instances of poverty from floods and drought alone. Water is about enough to explain the stubbornness of extreme poverty all on its own.