Category Archives: Uncategorized

Classes Diagram

Sometimes a diagram helps me find order in chaos, and sometimes it’s just a way to stroke my ego. I was recently trying to make sense of my graduate school classes, even as they’re becoming a less and less important share of my gradschool learning. So, I added to a diagram I’d made ten years ago for college.  In the end, I’m not sure which purpose it serves more.

classes

The diagram is arrayed by discipline and year. The disciplines are arranged like a color wheel (and classes colored accordingly), from theoretical math, through progressively more applied sciences, through engineering and out the other end into applied humanities (like music), and finally back to theoretical philosophy. Arrows give a sense of thematic and prerequisite relationships.

Economics, a core of the Sustainable Development program, probably sits around the back-side of the spectrum, between philosophy and math. I squeezed it in on the left, more as a reflection of how I’ve approached it than what it tried to teach.

This is also missing everything I’ve learned from classes I’ve taught. I wish there were a place for Progressive Alternatives from two years ago, or Complexity Science from last year. I guess I need another diagram.

Web Scraping in Python

I’m running a pair of seminars to introduce people to python, for the purpose of extracting data from various online sources.  I still need to write up the content of the seminars, with plenty of examples at from trivial to intermediate.  But first, I wanted to post the diagram I did for myself, to think about how to organize all of this material: a diagram.

How do the elements of python connect to each other, how do they relate to elements on the web, and how do elements on the web related to each other?

Scraping Python Tutorial

Boxes are python elements and ovals are web elements. I aimed to cover everything in brown, touch on items in blue, and at-most mention items in grey.

Risky Business Report released today!

Sol, Amir, and I have been slaving away over a report on the business-case for fighting climate change.  And it was released this morning!  The media outlets give a sense of the highlights:

Forbes:
Today’s report from Risky Business – the project chaired by Steyer, former U.S. Treasury Secretary Hank Paulson, and former NYC Mayor Michael Bloomberg – puts actual numbers on the financial risk the United States faces from unmitigated climate change.
New York Times:
[Quotes our guy:] “the most detailed modeling ever done on the impact of climate change on specific sectors of the U.S. economy.”

Huffington Post:
Parts Of America Will Be ‘Unsuited For Outdoor Activity’ Thanks To Climate Change, Report Finds

Financial Times:
For example, by the last two decades of the century, if greenhouse gas emissions carry on rising unchecked, the net number of heat and cold-related deaths in the US is forecast as likely to be 0.9 per cent to 18.8 per cent higher. But the analysis also shows a one in 20 chance that the number of deaths will rise more than 32.56 per cent, and another one in 20 chance that it will fall by more than 7.77 per cent.
Twitter:

#RiskyBusiness: By end of the century, OR, WA & ID could have more days > 95°F/yr than there are currently in Texas | http://riskybusiness.org/uploads/files/RiskyBusiness_PrintedReport_FINAL_WEB_OPTIMIZED.pdf …

2050: $66b-$106b of US coastal property likely under water, $238b-$507b worth by 2100 #ClimateChange #riskybusiness http://bit.ly/1sANaJj

Also Huff Po:
Higher temperatures will reduce Midwest crop yields by 19 percent by midcentury and by 63 percent by the end of the century.

The region, which has averaged eight days of temperatures over 95 degrees each year, will likely see an additional 17 to 52 of these days by midcentury and up to four months of them by the end of the century. This could lead to 11,000 to 36,000 additional deaths per year.

There’s also some over-the-top praise from the choir– Amir can send you some gems from
Capitalists Take on Climate Change.

Take a look!  Here’s the media report:
http://riskybusiness.org/report/overview/executive-summary

And the scientific report (what we actually helped write):
http://rhg.com/reports/climate-prospectus

Trying a new system

Sometimes I think the Catholic church is right to fear Dungeons and Dragons.  There are pearls of wisdom there that threaten society’s core.  Today, for me, it’s dice.

Many people worship randomness– from horoscopes to sports to stocks– and find great strengths in it.  The trick to building a divine system of randomness is to ensure long tails: that unlikely events still happen.  In D&D, it’s called a critical hit.  Usually, success is determined by a 20-sided die, and good things happen if you roll high.  If you roll a 20, great things might happen: to find out, you roll again (and again, as needed).

I’m making a system of randomness not as a solution, but to learn from the long tail.  The general rules are simple:

  • Every day, I must flip at least one coin (I have a coin labeled ‘1’), which determines one deliverable for that day.  H means, “Do for yourself or community”; T means, “Do for the world or the future.”
  • I can ask any binary question by flipping a coin.  H means, “The answer is routine”; T means, “The answer is different”.
  • If I flip tails, the degree to which the answer is different can be determined by more flips, with each successive T representing a departure of about the same magnitude.
  • I am generally not compelled to continue asking questions, but if I engage in the same sequence of flips twice, I must either come up with a new interpretation or do additional flips.
  • To make it easier to get my fortune for the day, I can assign meaning to each of several coins, and flip them all at once.

All the other rules grow organically.

Records Management Software?

Does anyone have a favorite software for keeping records of their documents? I don’t need anything very complicated, but I think it would need the following minimum features:

* Handles both electronic and physical documents.
* Let’s me specify a hierarchical location for each (e.g. server:directory for electronic and box:folder for physical).
* Adding pictures/scans of documents should be easy.
* Meta-data, notes, and tags, with searches over them.
* Adding new documents with minimal information should be very fast.

Working Paper Titles

I recently had to go through my projects and collect a list of working titles for anything that had reached some kind of draft stage. I’m posting these here for prosperity.

  • Multiscale management of the distributed fishery commons
  • Inferring spatio-temporal anchoveta stocks using catch series and plankton measurements
  • Entropy rates of spatially distributed state machines
  • Optimal Slash-and-Burn Farming
  • Glaciers and Flooding in Himalayan River Basins
  • An Open Model for Climate Behaviors
  • Self-Organized Criticality in Marine Ecology and Sustainable Development
  • A Tool for Crowd-Sourcing Empirical Meta-Analyses
  • Performance of agricultural process models using global data
  • Destabilization through crop failures: a mechanism for climate to drive conflict
  • System regressions: inferring the structure of interconnected feedbacks
  • No heat is an island: population as a driver of the heat island effect
  • Emotions, elections, and Hurricane Sandy
  • Probabilistic model coupling: an amalgamated approach to modeling
  • Planet on a plate: the drivers of food production and consumption decisions and their impacts
  • Global Benefits of Marine Protected Areas
  • Creating the commons: fisheries and the World Bank
  • Path Dependence, Political Competition, and Renewable Energy Policy: A Dynamic Model

The Logistic Map in Action

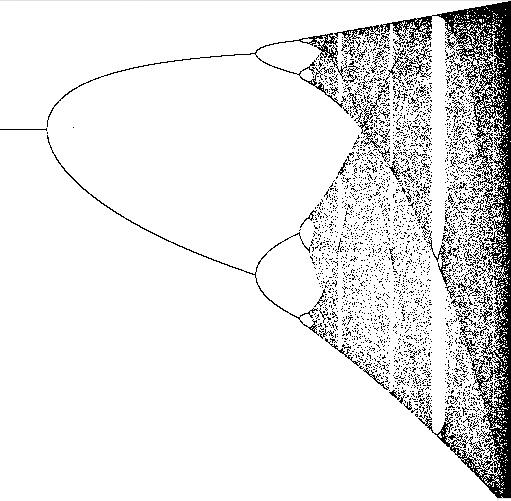
Everyone’s heard of the logistic map:
x_{n+1} = r x_n (1 - x_n)

It’s elegant, it’s powerful (a classic for modeling ecosystems, e.g.), and it’s incredibly chaotic. As you change r, its internal frequency doubles, and then redoubles over a shorter span, and then again and again, until it reaches an infinity frequency over a finite distance. So you get beautiful fractal pictures like the following, bursting with internal structure:
Static Logistic Map

But they rarely tell you how you get the picture, or what it means. The closest you get is that these are “asymptotic” values– a meaningless statement for something that never settles down.

So, I made an animation. In it, I just keep adding new points, each with a value of r and an initial value of x, and let them fly.

Table of Contents from “The Sacred Writings of the World’s Greatest Religions”

My Oakland apartment came with a single shelf of rather interesting books, including an anthology of religious texts called “The Sacred Writings of the World’s Great Religions”, by S. E. Frost, 1943.

I’ve gotten quite taken with it. It’s definitely edited for a Christian audience, and I there’s some Orientalism in its choice of “great religions”, but it does a great job of capturing the “good parts” of a number of works I’m familiar with, a nice balance between cutting and providing long-enough passages, and including a lot that I want to read.

I’ll be leaving Oakland in a few weeks, and started going through and collecting digital forms of all the material there, but I realized I was undoing much of the editing that I appreciated about the book. So, I’ve started to transcribe what I’m calling an “Extended Table of Contents“, and put it in dropbox so you can see it while I fill it out.

It’s actually an org-mode file, but you can read it as text, and I’m labeling it a txt so you don’t have to download it to open it. So far, I just have the first part on Hinduism filled out beyond the simple table of contents, and I’ve included links to digital copies through Taoism.

If anyone else has well-edited anthologies that complement this one, I would love to hear them.